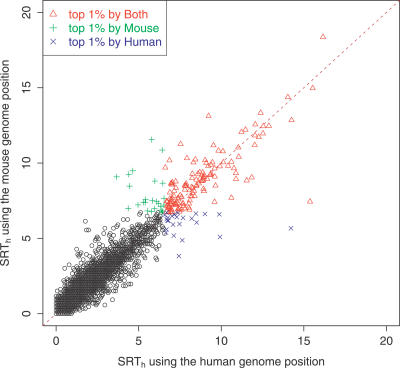
Figure 3. Robustness of the SRT Test (SRTh) to the Definition of Windows Used for Estimating the Null Tree Shape.
The SRTh values for amniotic CNCs were computed separately based on windows defined using the human genome position (x-axis) and the mouse genome position (y-axis). Signals that are in the top 1% by both window definitions are shown in red. Eight outliers above 20 were removed from the plot. The overall concordance between the two datasets implies that changes in synteny between human and mouse do not greatly disrupt our sliding window estimation procedure.

