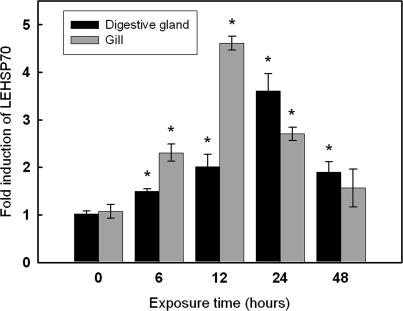
Fig 4.
mRNA expression level of LEHsp70 at different time points after heat treatment. Transcript levels for all samples were assessed by semiquantitative reverse transcriptase–polymerase chain reaction (RT–PCR) with SYBR Green, and the relative expression of Hsp70 was obtained relative to β-actin expression. Values are expressed as means ± standard deviation of the relative variations (fold induction) between each treatment and control sample; asterisks above the bars indicate differences from the control sample that are statistically significant (*P < 0.05)

