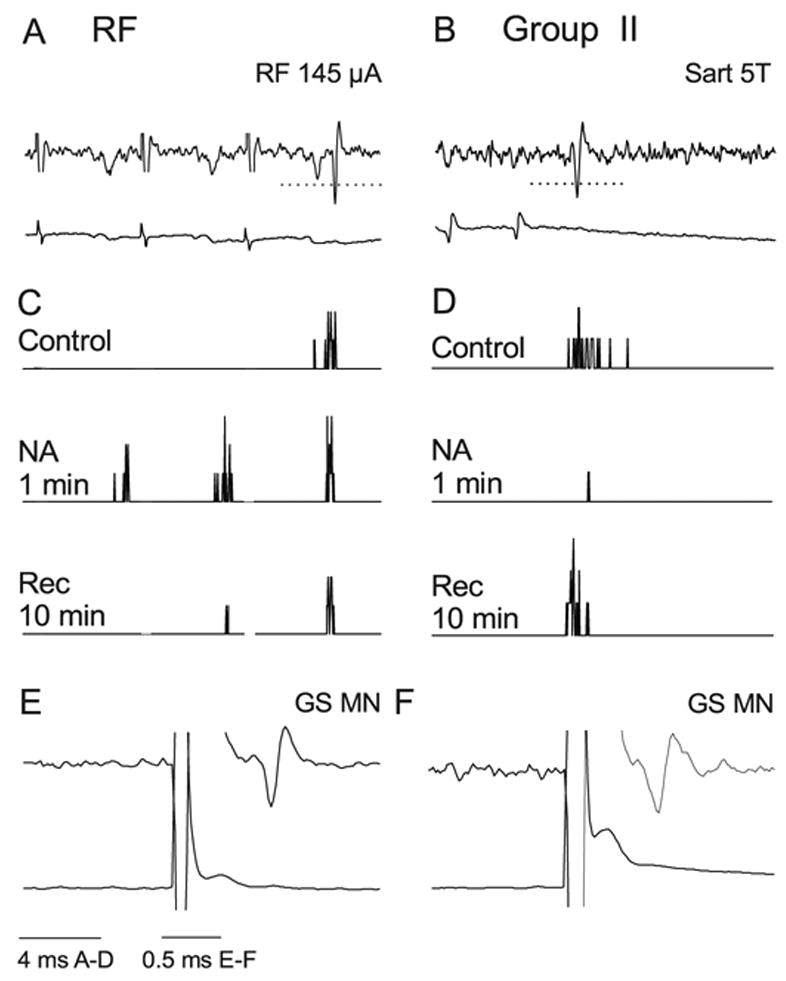
Fig. 3.

Facilitation of responses to RF stimulation and depression of responses to group II activation by NA. (A and B) Extracellular records of monosynaptic responses to stimulation in the RF and of group II afferents in the Sart nerve in two different commissural interneurons and records from cord dorsum. Shock artefacts have been truncated. (B and D) PSTHs of responses evoked by 20 consecutive stimuli recorded before (control), during and after ionophoresis of NA. Note that in B only the third stimulus evoked spikes during the control period, whereas the first and second stimulus also evoked spikes during ionophoresis. The facilitated responses which appeared after the first stimulus were used for the pooled data of Fig. 4. The dotted horizontal lines in A and B indicate the discrimination level; only spikes crossing these lines were used for constructing the histograms. (E and F) Spike potentials evoked from GS motor nucleus; latencies < 1 ms show that they were evoked antidromically.
