
Fig. 6.
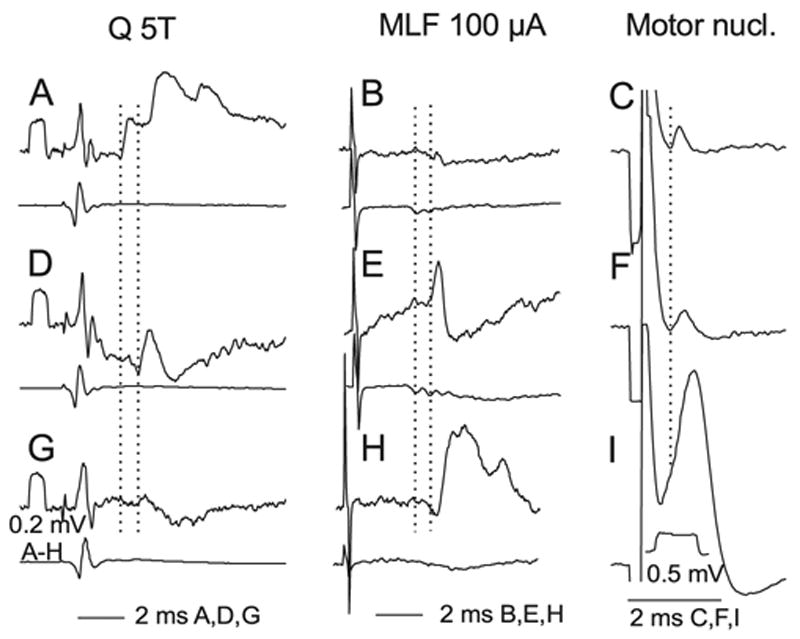
Examples of intracellular records from labelled interneurons. The three rows show intracellular records (upper traces) from three interneurons (nos 2, 6 and 3 from Table 1), together with records of afferent or descending volleys (lower traces). The left column shows effects of stimulation of group II afferents in the Q nerve; (A) monosynaptic and disynaptic EPSPs, (D) an EPSP that is either monosynaptic or disynaptic, and (G) a disynaptic IPSP (possibly preceded by a very small EPSP as in D). The dotted vertical lines indicate the onset of monosynaptic and most probably disynaptic PSPs. The middle column shows the effects of stimulation of reticulospinal tract fibres: evoking a monosynaptic EPSP in H, a monosynaptic EPSP followed by IPSP in E and no clear response in B. Dotted lines indicate the first components of the RF descending volleys and onset latencies of the earliest monosynaptic EPSPs. The right-hand column shows the effects of stimuli applied in GS motor nuclei: small initial segment and soma-dendritic spike in I and blocked spikes in C and F. These impaled neurons ceased generating full actions potentials briefly after penetration. The dotted vertical line indicates onset of the two earliest spikes.