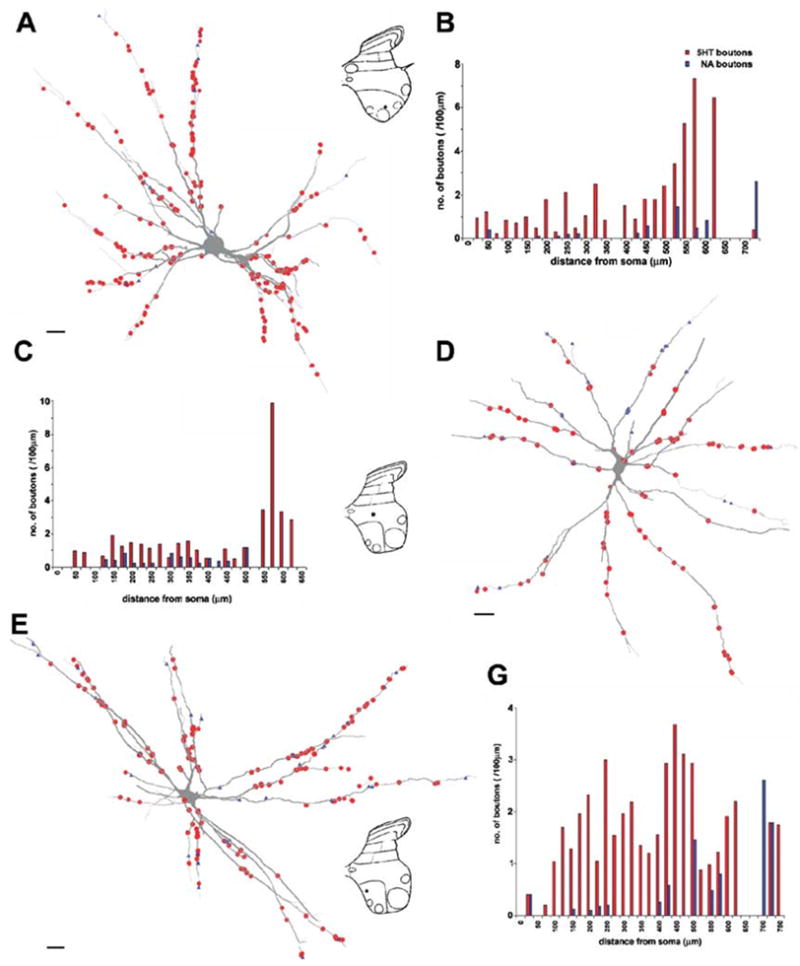
Fig. 8.

Distribution of 5-HT- and NA-immunoreactive terminals on three commissural interneurons. (A, D and E) Reconstructions of the dendritic trees of three commissural interneurons, with input from group II afferents, from RF and from both (nos 2, 6 and 3, respectively, in Table 1) and distributions of 5-HT (red circles) and d.b.h. (blue triangles) contacts throughout their dendritic trees. Insets show the positions of cell bodies within spinal grey matter. (B, C and G) Sholl plots for the two types of varicosity showing the distribution (number per 100 μm dendritic length) of contacts at 25-μm intervals throughout the dendritic tree. Data sets in red represent 5HT-immunoreactive boutons, in blue d.b.h.-immunopositive boutons. Records from these cells are shown in Fig. 6A–C, D–F and H and I, respectively. Scale bars, 20 μm.
