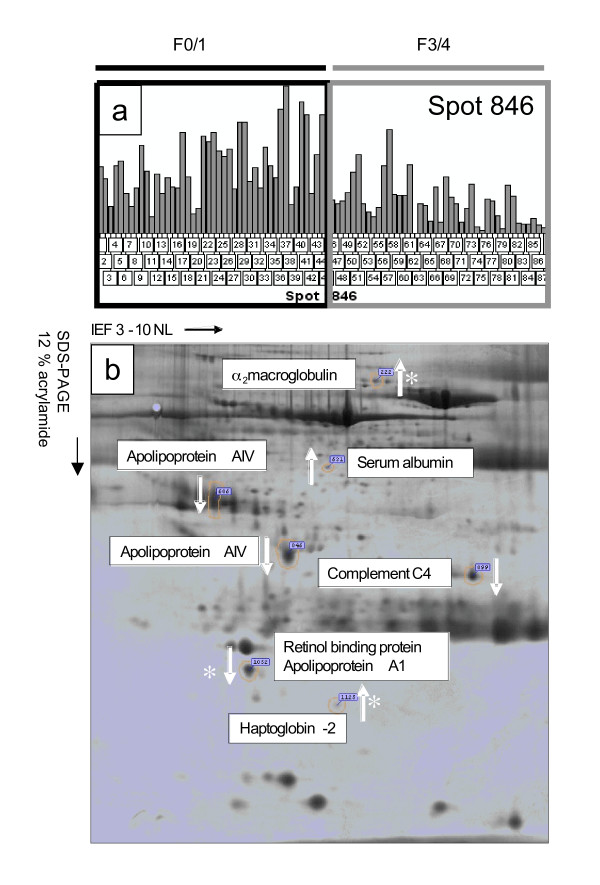
Figure 2.
Spot Selection and Two-dimensional Map of Putative biomarkers. (a) Image analysis output from Progenesis showing the relative volume (pixel intensity * mm2) of smaller variant of ApoA4 (spot 846) across all experimental gels. Gel 52 was excluded from analysis due to aberrant isoelectric focusing. (b) Image of 2D PAGE showing positions of putative markers. The direction of change (advanced relative to moderate disease) is indicated by the white arrows, and the asterisk signifies proteins whose behavior is consistent with the commercially available FibroTest. Expression of albumin reflects fragments not adsorbed by affinity-based mimetic ligands.

