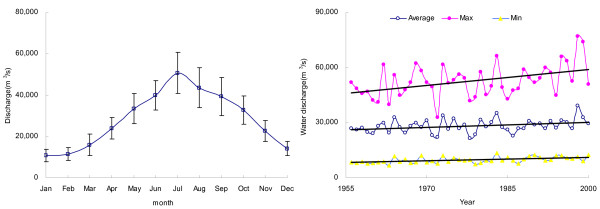
Figure 2.
Hydrographic features of Changjiang at Datong. Left:Monthly variation in the water discharge of Changjiang at Datong (average for the period 1956–2000). Right: the annual variation, minimum and maximum water discharge of Changjiang at Datong (from 1956 to 2000). Fit equation for the trend analysis of annual water discharge: y = 87.773x - 145469 r2 = 0.1029 p < 0.05.

