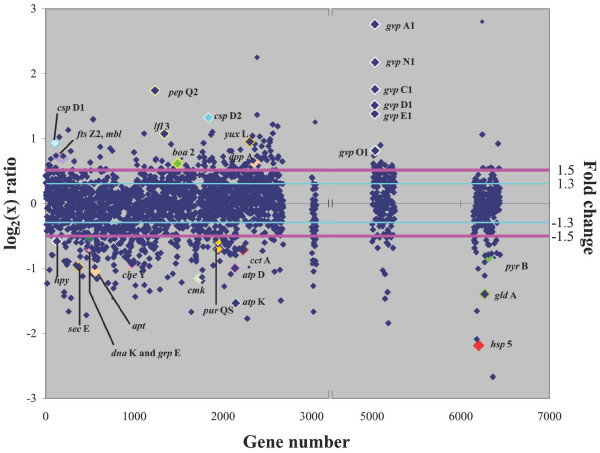
Figure 6.
Scatter plot comparing DNA microarrays hybridized with cDNA from Halobacterium sp. NRC-1 cultures grown in cold (15°C) and standard (42°C) temperatures. The log2 value of the Cy5/Cy3 ratio for each gene (abscissa) is plotted versus the gene number (ordinate). Gene numbers correspond to the chromosomal genes (1–2679), RNA genes (3000 to 3051), pNRC100 genes (5000 to 5256), and pNRC200 genes (6000 to 6487). Pink line represents a fold change value of 1.5 and the light blue line represents a fold change value of 1.3. Colors have been added for emphasis.

