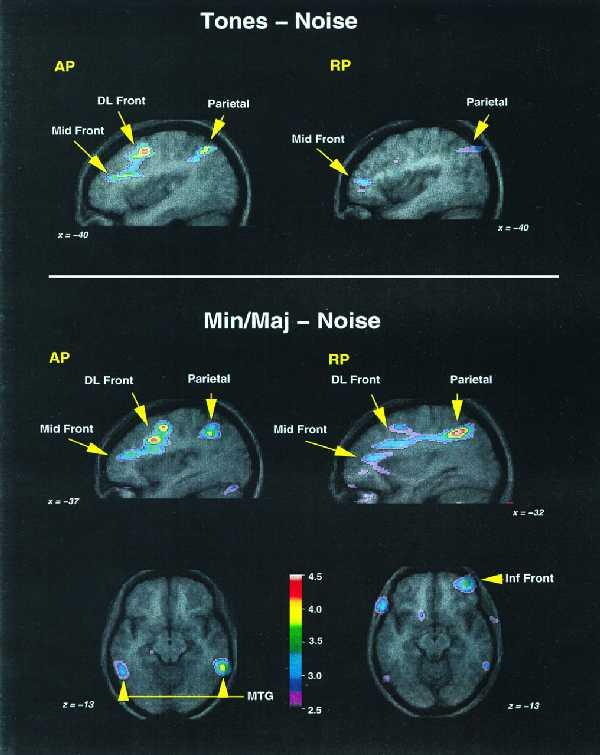
Figure 2.

(Upper) Averaged PET subtraction images are shown superimposed upon the averaged MRI scans for the tones-minus-noise subtraction for listeners with AP (Left) and control musicians—RP (Right). Focal changes in CBF are shown as a t statistic image, values for which are coded by the color scale at the bottom. The two saggital slices, taken at 40 mm to the left of midline, illustrate changes in the midfrontal and parietal regions, common to both groups (Table 2, foci 2 and 6), and a large focal area of CBF increase in the left dorsolateral (DL) frontal cortex (Table 2, focus 1), present only in the AP group (for stereotaxic coordinates and t values for these foci, see Table 2). (Lower) PET/MRI data for the minor/major-minus-noise subtraction for listeners with (Left) and without (Right) AP. The two saggital sections, taken at 37 and 32 mm to the left of midline, illustrate the similar CBF foci in the left DL frontal, midfrontal, and parietal regions for both groups of subjects (Table 3, foci 1, 2, and 8). The two horizontal sections, taken at 13 mm below the bicommisural plane, illustrate the right inferior frontal focus (Table 3, focus 5) present only in the RP group; foci within the middle temporal gyri (MTG) bilaterally are shown in the AP group but were also present, albeit more weakly, in the RP group (Table 3, foci 6 and 7; for stereotaxic coordinates and t values for these foci, see Table 3).
