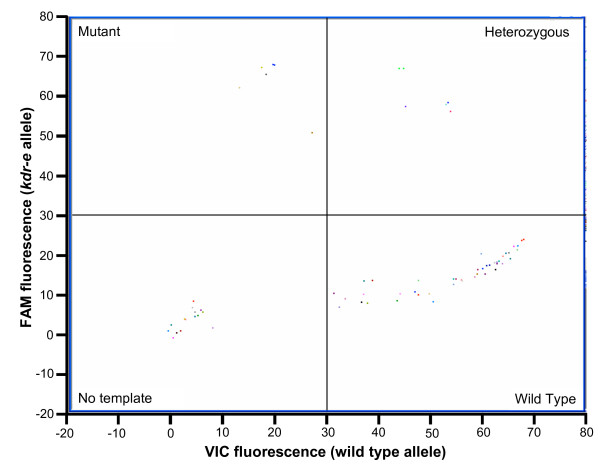
Figure 3.
Scatter plot analysis of TaqMan fluorescence data. In this example real time PCR was carried out using the east kdr assay on ~70 samples from the 96 samples reference plate then fluorescence values of the FAM labelled probe specific for the kdr-e mutation were plotted against the VIC labelled probe specific for the wild type allele.

