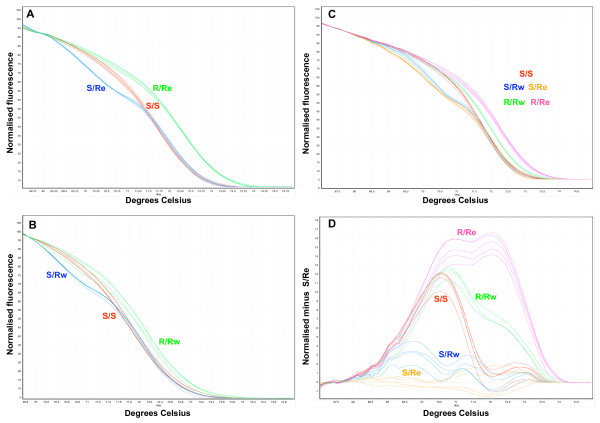
Figure 5.
High Resolution Melt (HRM) for detection of kdr-e and kdr-w mutations. A) HRM detection of kdr-e allele. B) HRM detection of kdr-w allele. C) HRM detection for both kdr-e and kdr-w mutations. D) The melt curve profiles shown in C plotted as a difference plot as an aid to visual interpretation. In this case the difference in fluorescence of a sample to a selected control (in this case an S/Re genotype control) is plotted at each temperature transition. S: Wild type allele (L1014), Rw: Resistant allele, West African mutation (L1014F), Re: Resistant allele, East African mutation (L1014S).

