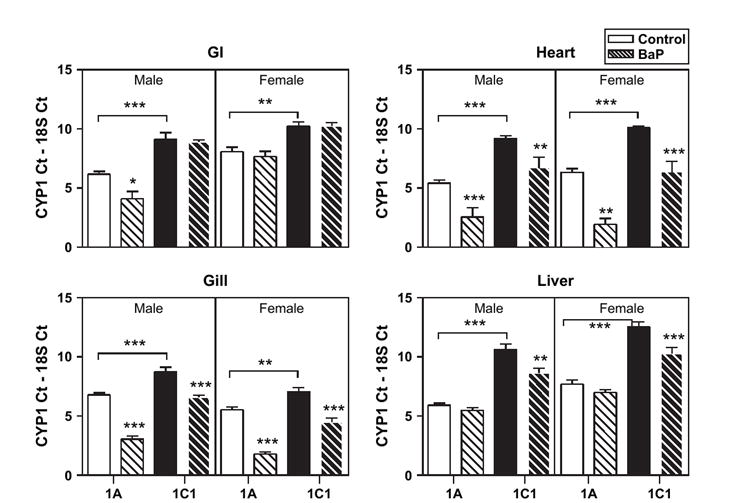
FIG. 3.

CYP1A (white bars) and CYP1C1 (black bars) mRNA expression in control (solid bars) and BaP-exposed (thatched bars) adult Fundulus. Four tissues (GI, heart, gill, liver) had significantly higher constitutive CYP1A expression in both sexes. See Figure 2 for explanation of bars. Significant differences between treatment and control or differences between CYP1 constitutive expression are noted. Bars represent mean and standard error of the mean (*p < 0.05; **p < 0.01; ***p < 0.001; ANOVA, n = 3–5).
