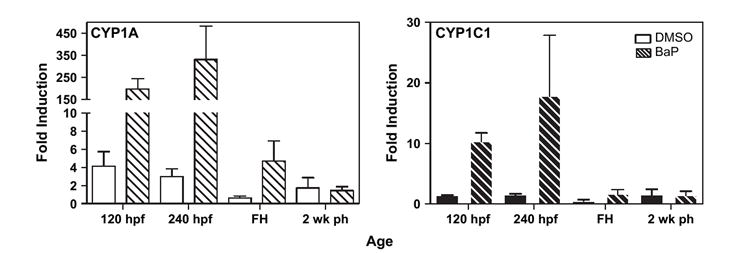
FIG. 7.

BaP effects on CYP1A (white bars) and CYP1C1 (black bars) mRNA level in a pool of 10 whole embryos (n = 4). Each bar represents mean and standard error of the mean of the fold increases in CYP1 expression in DMSO control (solid bars) or BaP treatment (thatched bars) relative to the untreated group at each age.
