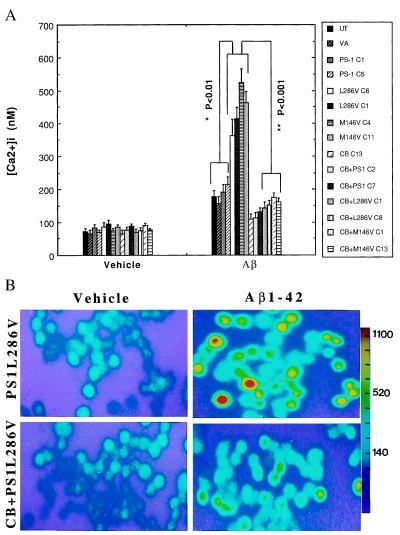
Figure 2.
Increases of [Ca2+]i induced by Aβ are enhanced in cells expressing mutant PS-1 and attenuated by overexpression of calbindin. (A) Cells were exposed for 4 hr to 50 μM Aβ1–42 and the [Ca2+]i in individual cells was quantified by fluorescence ratio imaging of the calcium indicator dye fura-2 (see Fig. 1 for cell lines). Values are the mean ± SD of determinations made in three cultures (50–80 cells per culture; ANOVA with Scheffe’s posthoc tests). (B) Ratio images of intracellular calcium levels in PC12 cells expressing mutant PS-1 alone (PS1L286V) or in combination with calbindin (CB+PS1L286V) 4 hr after exposure to either vehicle (water) or 50 μM Aβ1–42. The [Ca2+]i is represented on a color scale shown at the right (values are nM).

