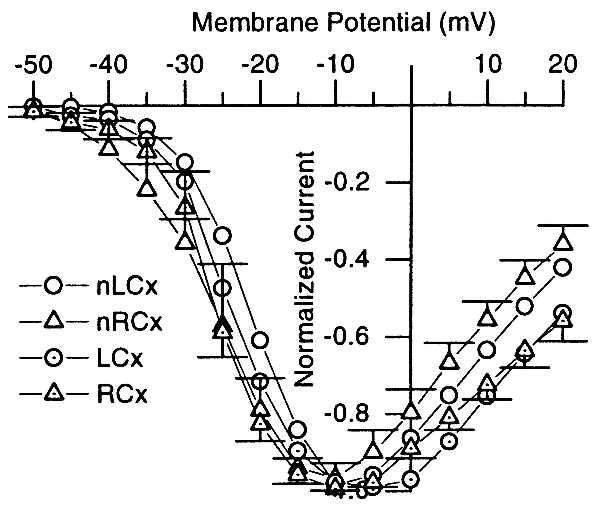
Figure 5.

Activation curves for sodium currents in oocytes injected with nLCx, nRCx, LCx, or RCx mRNA. Currents for each oocyte were normalized relative to the largest current within the range tested. Each point and error bar represent the mean of normalized currents ± SEM.
