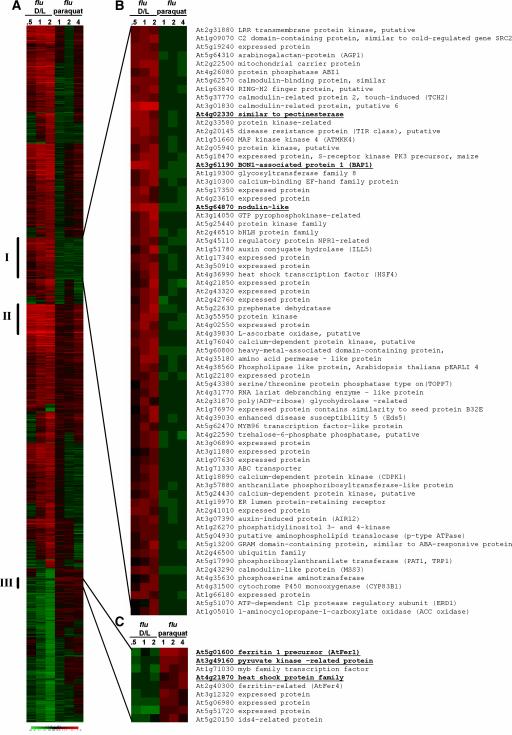
Figure 6.
Cluster Analysis of the Expression of Early Stress-Response Genes in the flu Mutant of Arabidopsis after the Release of Singlet Oxygen and Hydrogen Peroxide.
RNA samples were prepared 0.5, 1, and 2 h after the transfer of plants from the dark to the light (flu D/L versus wild-type D/L) and 1, 2, and 4 h after spraying plants with paraquat (flu treated with 20 μM paraquat in 0.1% Tween versus flu treated with 0.1% Tween). Affymetrix gene chips were used that represent ∼24,000 genes. A total of 1206 genes with 2.5-fold or greater differential expression that were either upregulated or downregulated in at least one experimental condition were selected and analyzed (A). One subcluster (group I) represents 70 genes that are upregulated specifically after the release of singlet oxygen, whereas a second subcluster (group III) represents 9 genes whose transcript levels increase selectively after the release of hydrogen peroxide. The members of each of these two groups are shown in (B) and (C), respectively. A third subcluster (group II [A]) consists of 31 genes that are upregulated at least 2.5-fold under both conditions. Each horizontal line displays expression changes for one gene. Degrees of red and green indicate the extent of positive and negative regulation. Gene accession numbers are shown at right of each cluster in (B) and (C). Numbers shown in boldface and underlined indicate genes that were selected for an independent second analysis of mRNA changes by real-time PCR (see Figure 7). Expression data not shown are accessible in the supplemental data online.

