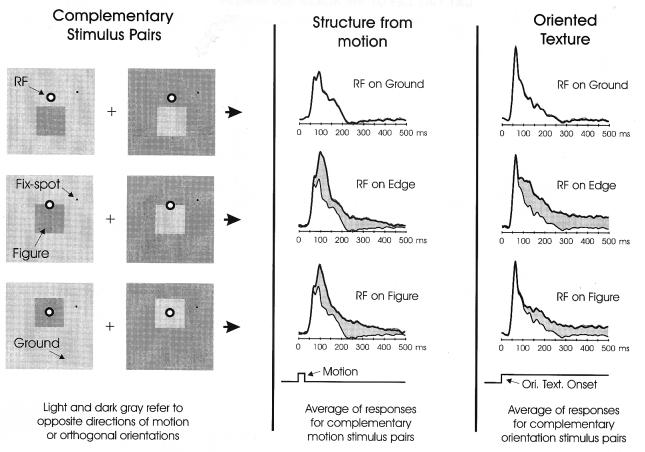
Figure 2.
Sampling of V1 neural responses with the RF located at various positions in the figure-ground displays. To avoid having results depend on local RF features such as texture orientation or direction of motion, we always used complementary pairs of stimuli with the same figure-ground relationships but opposing local features (Left); for a given position of the RF relative to the figure, the responses to these complementary stimuli were averaged. The results for structure from motion (Middle) and oriented texture (Right) are shown. For purpose of comparison, the response for the RF on ground is depicted in composite (thin lines) with edge and figure responses. The difference in response is indicated by gray shading. SEM of each response is given by the dotted lines above each plot. When the RF appeared on the edge or within the motion-defined figure, an elevation in response can be seen, relative to the response to ground, that faded approximately 500 ms after motion onset. When the RF appeared on the edge or within the orientation-defined figure, a persistent elevation in response, relative to the ground response, is observed for as long as the figure remains. The responses shown are the average from all 32 micro-electrodes implanted in area V1 of two awake, behaving macaque monkeys trained to maintain fixation during stimulus presentation.

