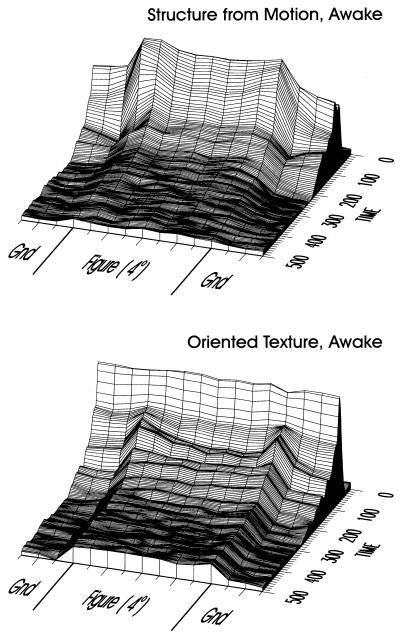
Figure 3.
Spatio-temporal representation of neural activity in response to figure-ground displays in awake monkeys. The figure-ground display was sampled at 15 positions (including the three shown in Fig. 2); samples were taken at 0.5° increments across the figure-ground display. For both the structure-from-motion display (Upper) and for the oriented-texture display (Lower), a uniform level of elevated activation within the figure region of the display evolves after the initial response. Before being combined in the population average, the responses from each electrode were normalized by the maximum of the responses evoked at the various positions of RF relative to figure. In this way, each electrode contributed equally to the average, independent of the absolute response level at the particular electrode.

