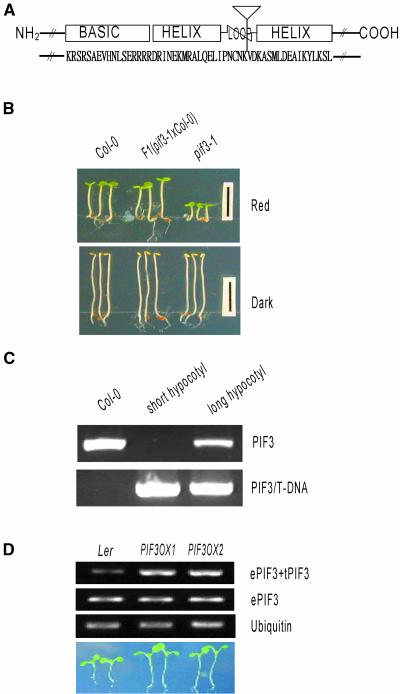
Figure 1.
Phenotypes of the pif3-1 Mutant and PIF3OX.
(A) Diagram of the PIF3 protein and the T-DNA insertion site. The inverted triangle indicates the T-DNA insertion site, and uppercase letters indicate the amino acid sequence corresponding to the bHLH region in PIF3.
(B) Hypocotyl phenotypes of wild type Columbia (Col-0), pif3-1, and heterozygous PIF3 [F1(pif3-1×Col-0] plants.
(C) Cosegregation analysis. Col-0 indicates genomic DNA of the wild-type plant, short hypocotyl indicates a genomic pool of 40 seedlings that had short hypocotyls and larger cotyledons, and long hypocotyl indicates a genomic pool of 126 seedlings that had long hypocotyls and smaller cotyledons. PIF3 indicates the PCR product of full-length PIF3, and PIF3/T-DNA indicates the PCR product of the PIF3–T-DNA hybrid fragment.
(D) Overexpression of PIF3 in transgenic plants. ePIF3 indicates endogenous PIF3, and tPIF3 indicates transgenic PIF3 in the PIF3-overexpressing lines (PIF3OX1 and PIF3OX2). The photograph at bottom shows the hypocotyl lengths of wild-type Landsberg erecta (Ler) and PIF3OX plants grown under white light.

