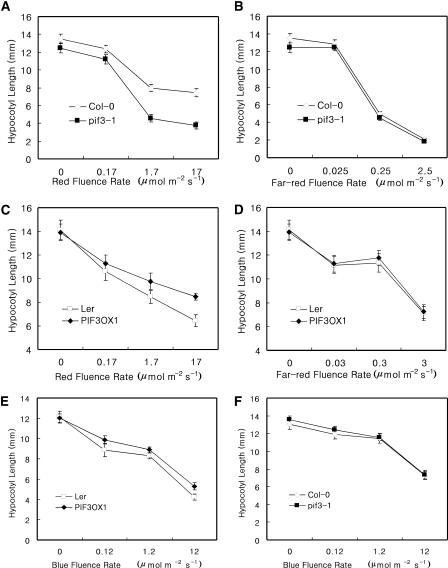
Figure 2.
Red and Far-Red Fluence Rate Response Curves for Hypocotyl Lengths.
(A) Red light fluence rate response curve of pif3-1 plants.
(B) Far-red light fluence rate response curve of pif3-1 plants.
(C) Red light fluence rate response curve of PIF3OX plants.
(D) Far-red light fluence rate response curve of PIF3OX plants.
(E) Blue light fluence rate response curve of PIF3OX plants.
(F) Blue light fluence rate response curve of pif3-1 plants.

