Figure 1.
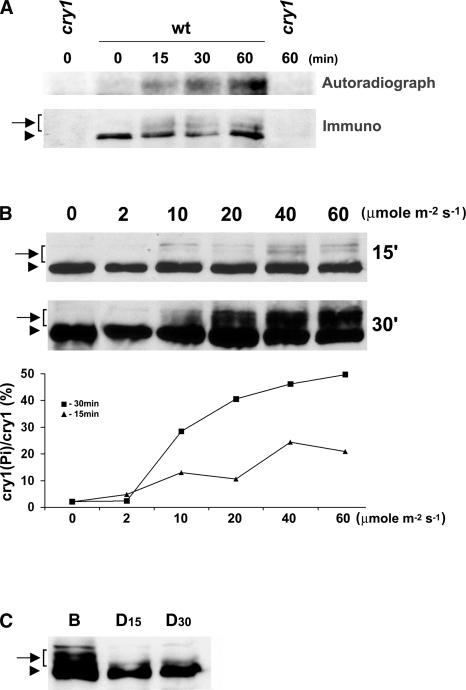
Blue Light–Dependent Phosphorylation of cry1.
(A) Five-day-old etiolated seedlings were cut above the roots and incubated with 300 μCi of 32P-H3PO4 in water for 3 h in the dark. The tissue aliquots were exposed to blue light (30 μmol·m−2·s−1) for the time indicated or kept in darkness. The cry1 protein was immunoprecipitated with anti-CRY1 antibodies, separated on a 10% SDS-PAGE gel, blotted to a membrane, and analyzed by autoradiography (Autoradiograph) and then by probing an immunoblot with anti-cry1 antibodies (Immuno).
(B) Immunoblots of samples prepared from wild-type seedlings exposed to blue light for 15 min (15′) or 30 min (30′) at the fluence rate indicated were probed with the anti-CRY1 antibody. The signals of the slow-migrating bands (indicated by the arrow-bracket) are normalized to the fast-migrating band in the same lane (arrowhead), represented as [cry1(Pi)/cry1 (%)], and plotted against the fluence rates (graph at bottom).
(C) Immunoblot showing dephosphorylation of cry1 in the dark. Etiolated seedlings were exposed to blue light (B; 30 μmol·m−2·s−1) for 1 h and then transferred to dark. Samples were prepared before or after seedlings were transferred to darkness for 15 or 30 min (D15 and D30).
Arrows with brackets indicate phosphorylated cry1; arrowheads represent nonphosphorylated cry1. wt, wild type.

