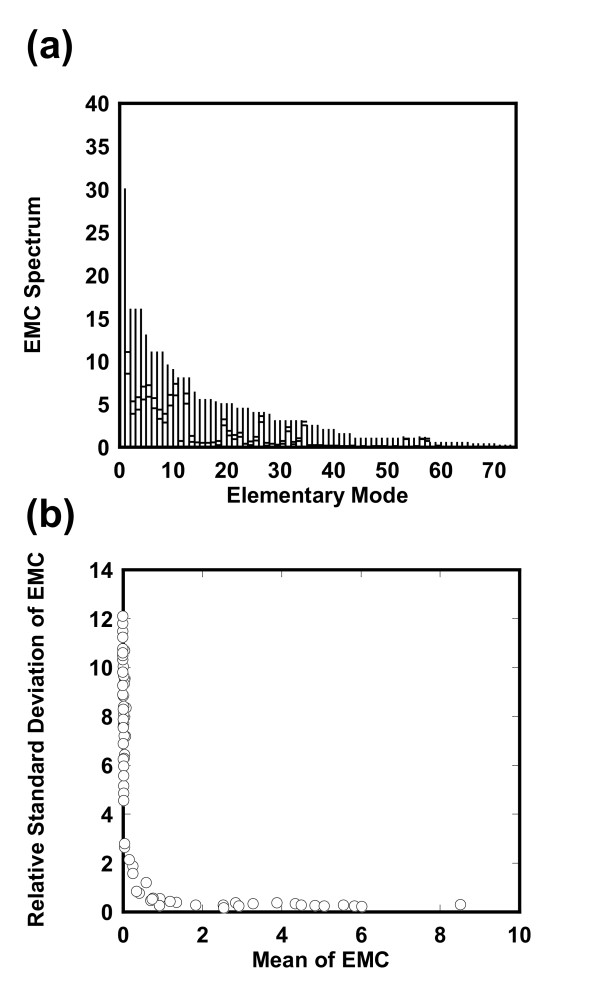
Figure 3.
Estimated EMCs in the pykF(-) knockout mutant. (a) Spectrum for the EMCs with respect to elementary modes. The EMCs with respect to the (2j-1 and 2j)-th optimization trial are calculated by maximizing or minimizing the j-th EMC (j = 1, 2, ..., 73). EMs are sorted according to their maximum values. The vertical lines indicate the allowable ranges for the EMCs. Each line has two transverse dashes at the right: The lower one indicates the mean (m) and the upper one is the sum of the mean and the standard deviation (σ). (b) Relative standard deviation of the estimated EMC spectrum. The relative standard deviations (σ/m) are plotted with respect to the means (m). Note that the mean EMCs are not zero.

