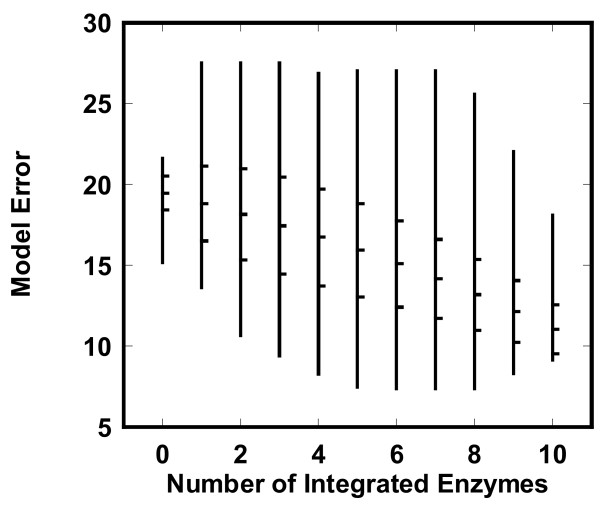
Figure 5.
Effect of the number of integrated enzyme activities on the model error in the pykF(-) knockout mutant. The model error was calculated for all combinations of the enzymes with measured activities. The vertical lines indicate the regions between the minimum and maximum values. Each line has three transverse dashes at the right: The middle dash is the mean of the model error. The upper and lower dashes indicate m + σ and m - σ, respectively (m and σ are the mean and the standard deviation of the model error, respectively).

