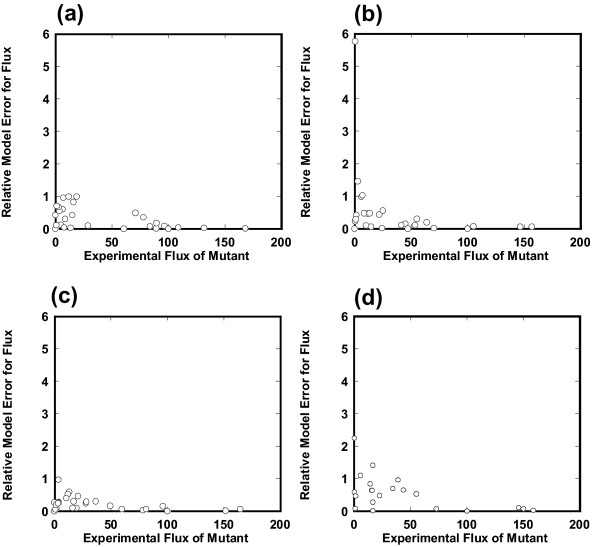
Figure 8.
Consistency of the estimated flux with experimental one for each reaction. We compared the estimated flux with experimental data for each reaction: (a) ppc (-) knockout mutant, (b) cra (-) knockout mutant, and (c) fnr (-) knockout mutant in E. coli. (d) als-overexpressing and pta (-) knockout mutant of B. subtilis. A β factor of 1 is used. The relative model error for flux is plotted with respect to its experimental flux. A small value of the relative model error for flux indicates that the simulated flux is consistent with the experimental one.

