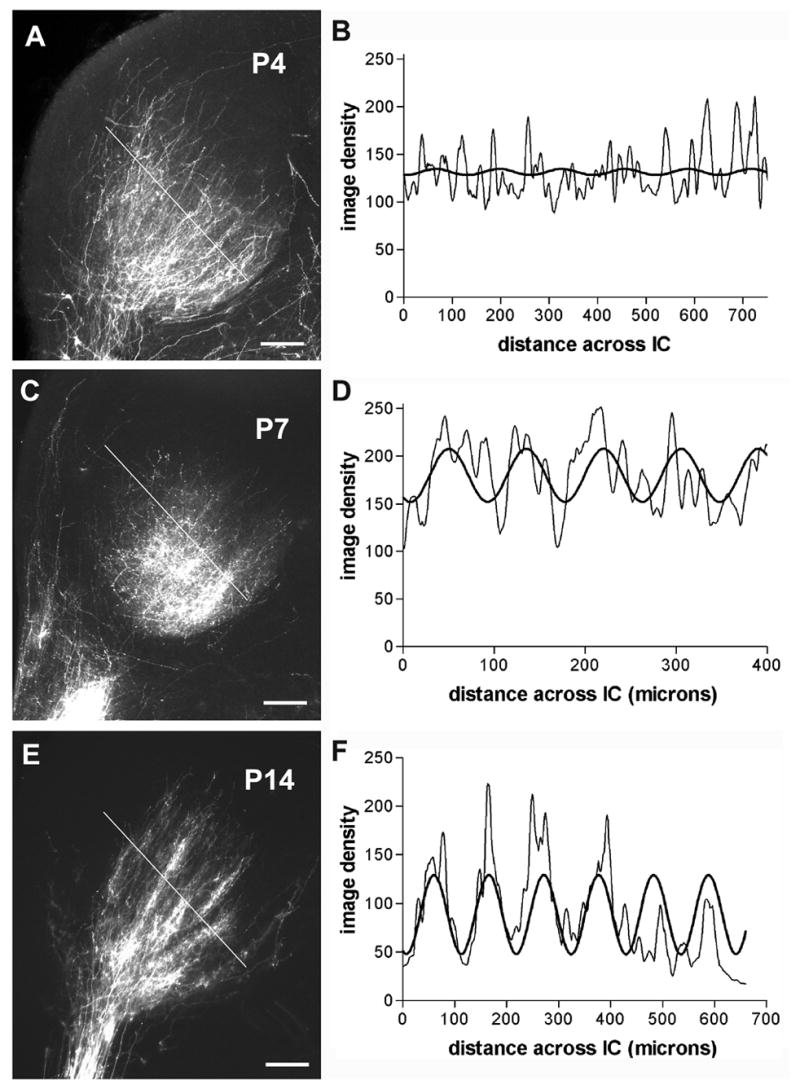
Figure 3.

Epifluorescent images (left column) of DiI labeled LSO projections to IC with corresponding graphs (right column) showing line profiles of image density (thin graph line) orthogonal to plane of axonal layers and best fit sine curves (thick graph line). Dashed lines in A, C, and E indicate the orientation of selected field across IC labeling for density analyses shown in B, D, and F, respectively. Developmental series shows gradual segregation of banded afferent compartments (A, B examples from P4; C, D examples from P7; E, F examples from P14 ferret). A, C, E – calibration bars equal 200μm.
