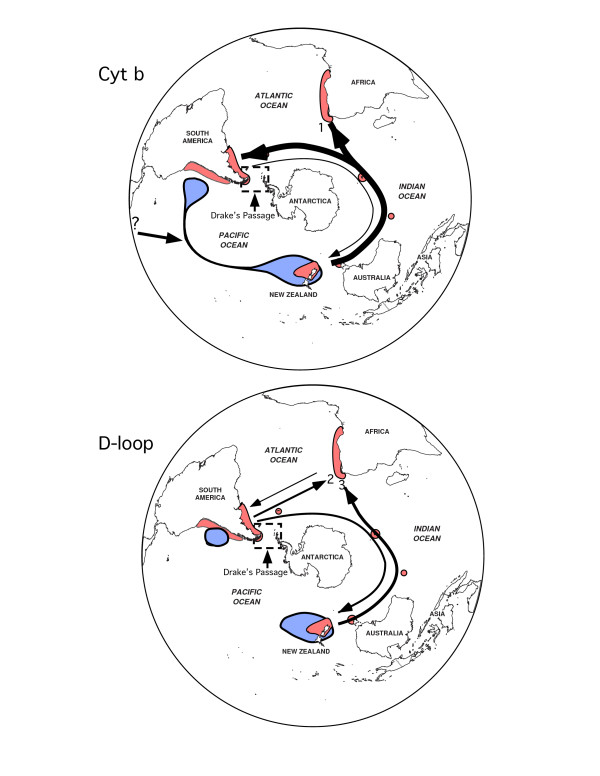
Figure 5.
Dispersal hypothesis synthesized from analyses of cytochrome b and d-loop sequence data. Blue shaded areas depict the hypothesized origin of the dusky dolphin from a trans-equatorial transgression of L. obliquidens, approximately 2 million years ago, that resulted in an early isolation of a Peruvian population and the founding of a population in New Zealand, which served as the source population for migration into the Atlantic. Arrow direction and thickness indicate the direction and magnitude (Table 3) of migrations, respectively. Only migration rates ≥ 1, the theoretical minimum necessary to maintain population cohesion, are depicted (Table 3). Under the assumption that the rate of evolution of the cyt b and d-loop regions vary, the comparison of the cyt b with the d-loop allows for a relative temporal interpretation of migration rates, with those from the d-loop representing more recent patterns. Based on this assumption, numbers at the end of arrows indicate the proposed 2–3 migrations into South Africa, perhaps following extirpation due to climatic fluctuations (see Discussion).

