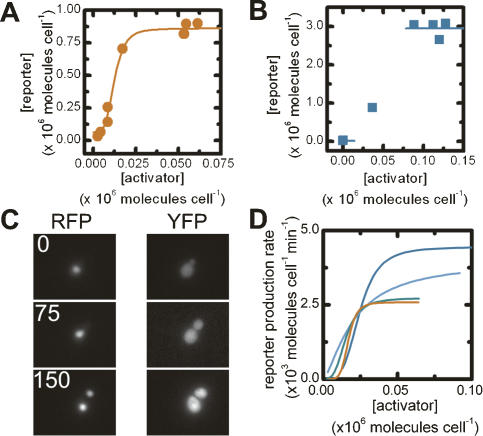
Figure 2.
Steady-state and dynamic behavior of activation cascades. The mean steady-state reporter versus activator concentrations for the ZifH (A) and LexA (B) activator–reporter strains. The solid lines show best fits to the data. Only s and β could be robustly determined in B. (C) Time-lapsed RFP and YFP fluorescence images of cells containing the ZifH activation cascade 0, 75, and 150 min after induction. (D) Rate of change of reporter concentration as a function of activator concentration for individual cells (red, blue, green, and light-blue lines).

