
Fig. 2.
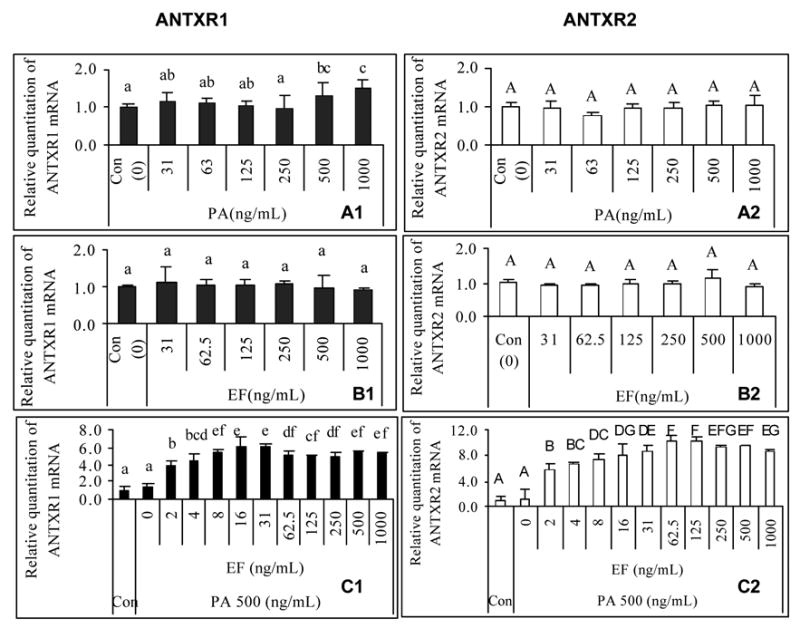
Effect of anthrax edema toxin on expression of ANTXR1 (Panel 1, left) and ANTXR2 (Panel 2, right) mRNA in J774A.1 cells. Total RNA was isolated from J774A.1 cells treated with different concentrations of anthrax toxin components, and then one-step real time RT-PCR was carried out to assess the relative abundance of ANTXR1 and ANTXR2 mRNA as compared to levels of 18S rRNA. One sample from control groups without toxin treatment was designated as a calibrator. Different letters represent significant differences between treatments in the same plot (P < 0.05). (A). PA-treated; (B). EF-treated; (C). constant PA + EF titration; (1). ANTXR1; (2). ANTXR2. (n = 8)