
Fig. 3.
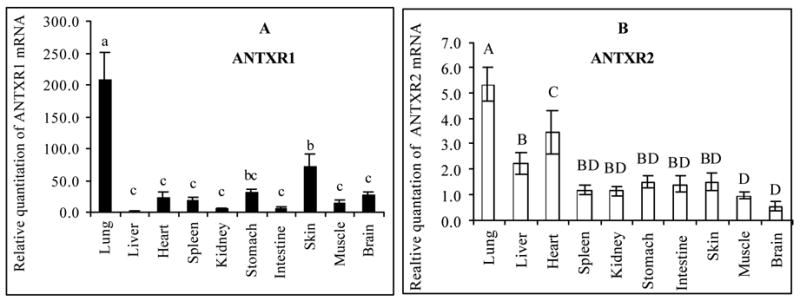
Differential expression of ANTXR1 (Panel A) and ANTXR2 (Panel B) mRNA in mouse tissues. Total RNA was isolated from A/J mouse tissues and one-step real-time RT-PCR was carried out to assess relative abundance of ANTXR1 and ANTXR2 mRNA as compared to 18S rRNA. A mouse liver total RNA sample purchased from Ambion was designated as a calibrator. Different letters represent significant differences between treatments in the same plot (P < 0.05). (n = 8)