
Fig. 1. Caspase activation increases BACE and APP-C99 levels.
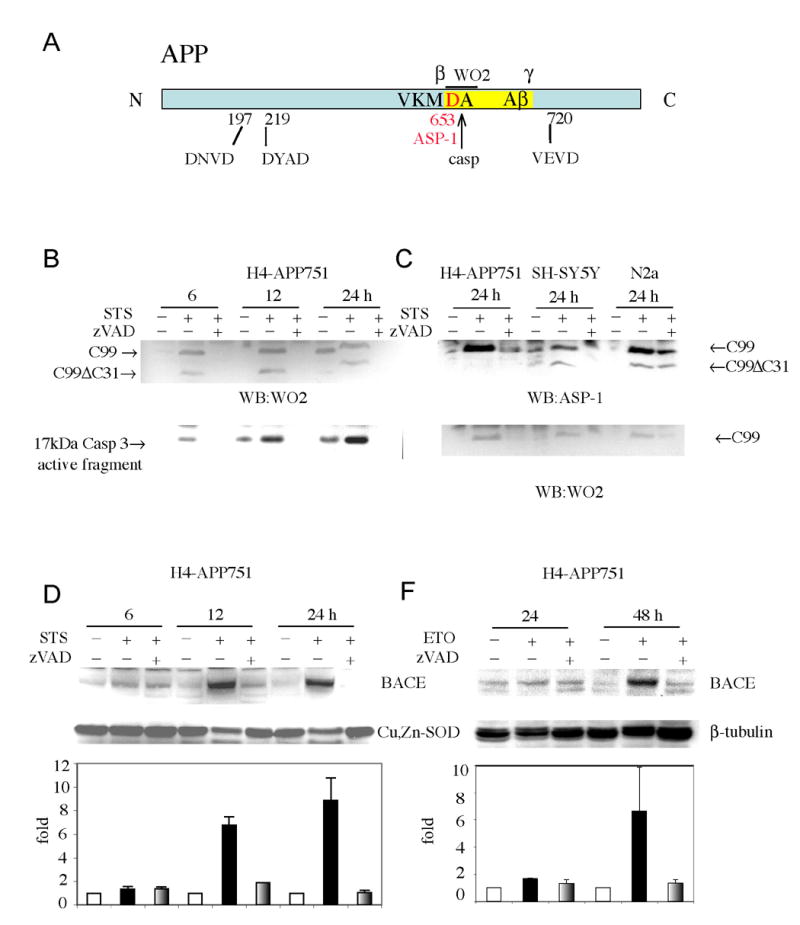
A: Schematic representation of APP caspase sites, and antibody recognition sites. B: Apoptosis was induced in human H4 neuroglioma cells expressing APP751 by STS treatment. Western blot analysis performed with WO2 antibody revealed APP-C99 and APP-C99ΔC31 during time-course experiments. Western blot analysis with anti-caspase 3 active fragment antibody showed caspase 3 activation as early as 6 hr during STS treatment. Limited caspase activity and a small increase of APP-C99 in the untreated cells at time point 12 (horizontally compressed band) and 24 hr was also detected in the control sample owing to the fact that the control cells were grown in serum-free media. C: WB analysis with an antibody, ASP-1 (Oncogene), that recognizes only the first aspartyl residue of Aβ region confirmed that the 12kDa APP fragment increasing following caspase activation is APP-C99 in the cells H4-APP751, and also in human SH-SY5Y and murine N2A cells expressing only endogenous APP. D-F: Western blot analysis with anti-BACE antibody revealed increased BACE protein levels following apoptosis induced by STS or etoposide treatment, respectively. Cu,Zn-SOD or β-tubulin were used as a loading control. Densitometry analysis was performed using NIH image software. The graphs represent BACE levels expressed as percentage increase versus BACE levels in control cells (100%). Each bar represents the mean ± SEM of at least three experiments.