
Fig. 8. Levels of GGA3 are decreased and are inversely correlated with increased levels of BACE in AD brains.
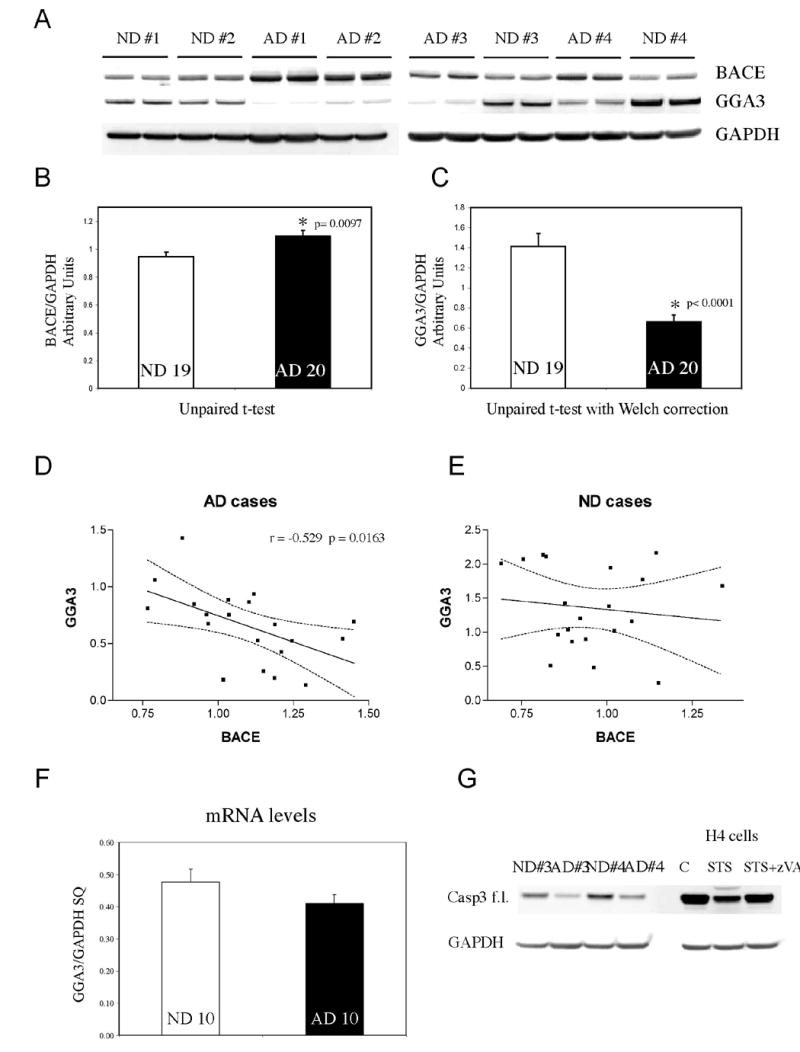
A. Western Blot analysis of temporal cortex of human brains. AD= Alzheimer's disease. ND= non-demented control. BACE was detected by SECB1. GGA3 was detected by anti-GGA3 antibody. GAPDH was used as loading control. B-C. BACE and GGA3 densitometry values were normalized against GAPDH values. At least triplicate of each samples were analyzed. The graphs represent mean ± SEM of 19 ND and 20 AD. Unpaired t-test and unpaired t-test with Welch correction ware used to perform statistical analysis of BACE and GGA3 levels, respectively. D-E. Linear correlation analysis between BACE and GGA3 levels in AD and ND, respectively. The dotted line indicates the 95% confidence interval. F. GGA3 mRNA was quantified by real time PCR. The graph represents mean ± SEM of 10 ND and 10 AD. SQ=starting quantity. Please note that the levels of GGA3 protein were significantly decreased in the same samples. G. Western Blot analysis of temporal cortex of human brains. AD= Alzheimer's disease. ND= non-demented control. Full-length caspase 3 was detected with anti-caspase 3 antibody. To show that full-length caspase 3 decrease during apoptosis, lysates from control (C), treated with (STS), and treated with STS+zVAD H4 cells were also included. GAPDH was used as loading control.