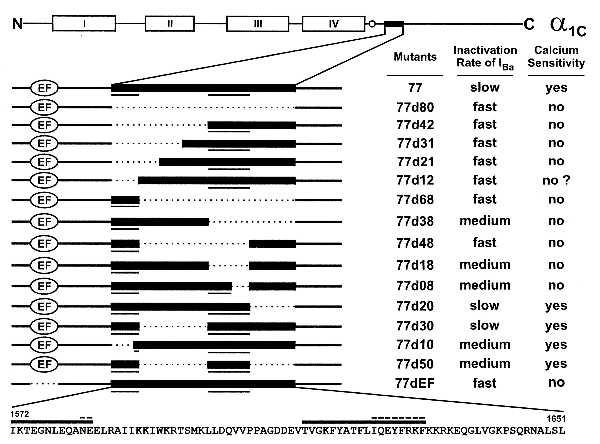
Figure 7.

Summary of inactivation characteristics for all deletion mutants studied. The schematic presentation of α1C and its deletion mutants (Top and Left) is as in Fig. 1. The two columns to the right qualitatively assess the inactivation rates of IBa (Table 2) and the calcium sensitivity of each construct. Calcium sensitivities are based on calcium sensitivity indices as shown in Fig. 6C. (Bottom) The amino acid sequence between positions 1572 and 1651 of α1C,77 is shown. The heavy bars above the sequence correspond to the underlined sequences in the upper schemes of mutants. The dashed lines above the bars indicate amino acid residues that were found to be essential for the conservation of Ca2+-dependent inactivation.
