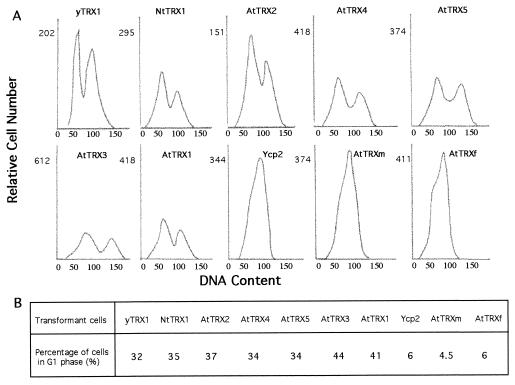
Figure 5.
DNA histograms of asynchronous cultures of transformed trx1, trx2 mutant cells. Cells were grown in YMGal medium to exponential phase and prepared for flow cytometry. In A the relative fluorescence intensity is plotted against the relative cell number. The two peaks observed for yTRX1, AtTRX1, … , AtTRX5, and NtTRX1 represent 1n and 2n DNA contents. For each sample, between 10,000 and 20,000 fluorescent events were measured. The proportion of cells in G1 phase estimated by fried software analysis is indicated in B.

