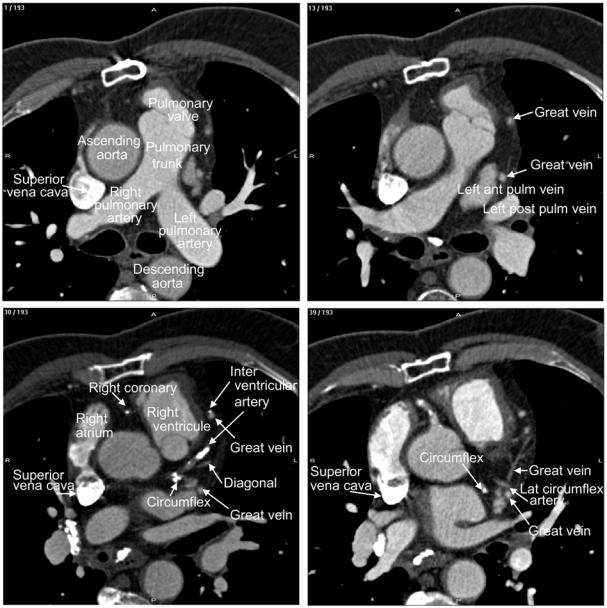
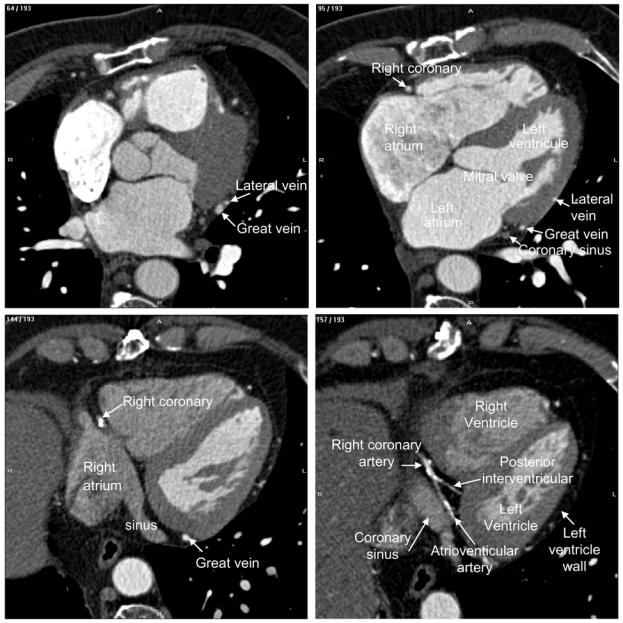
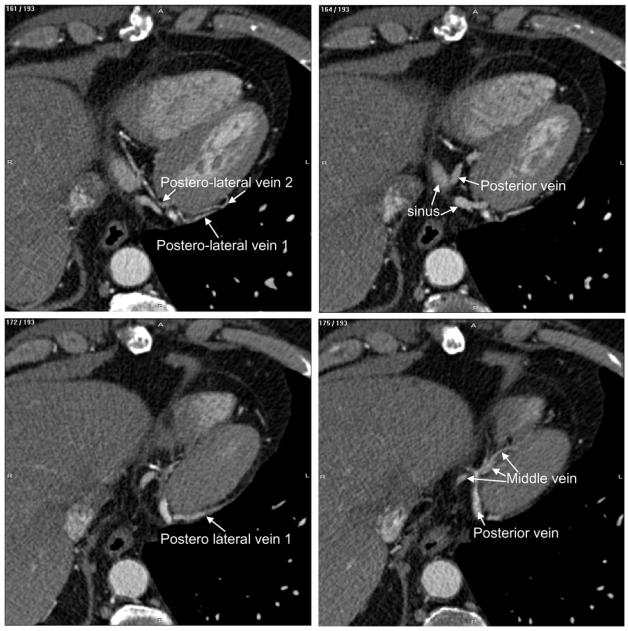
Fig. 2.


Labelling of heart structures in MSCT data. The dataset was acquired at 30% of the cardiac cycle. The subset of slices is composed of 12 labelled slices. The slices, selected to show different anatomical features, are numbered at the top left corner. The level window is between -100 HU and 700 HU. The letters A, P, R and L, that denote respectively anterior, posterior, right and left, are used to indicate the slice position relative to the patient’s body.
