Figure 1.
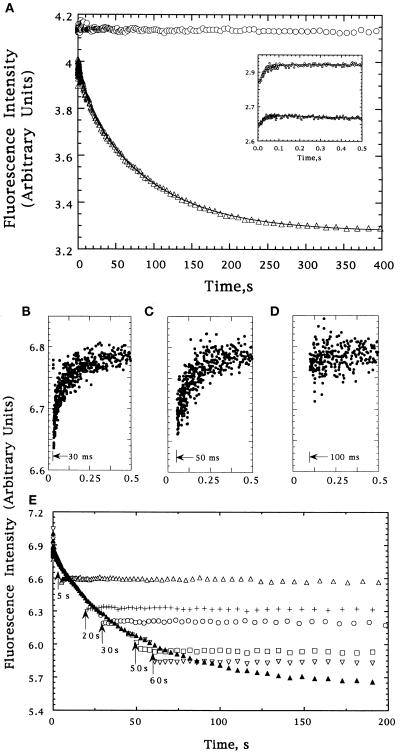
(A) Tryptophan fluorescence intensity changes of DHFR during refolding from 6 M urea in the absence (▵) or presence (○) of GroEL; the Inset shows the behavior for the first 0.5 sec. The data were fit to a sum of three exponentials using a nonlinear least-squares fitting program available from the SAS institute (Cary, NC). The lines reflecting these fits are shown. (B–E) Tryptophan fluorescence of refolding DHFR following addition of GroEL at various times after the initiation of folding. Injections after 30, 50, and 100 msec are shown independently in B–D, respectively. Injections after 5 (▵), 20 (+), 30 (○), 50 (□), and 60 (▿) sec are shown in E, as is a trace in the absence of GroEL (▴). The small differences between the intensity of the DHFR–GroEL complexes and the intensity of DHFR at the same folding times reflects the apparent cancellation of the decrease expected from the 2-fold dilution in the second mixing step by an increase due to addition of chaperone (50-fold excess by weight).

