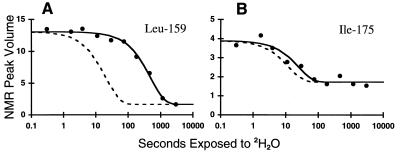
Figure 3.
Representative amide exchange data for residues Leu-159 (A) and Ile-175 (B). NMR peak volumes are plotted as a function of time of exposure of the GroEL-bound folding intermediate to 2H2O. The time scale is logarithmic. The solid lines are the result of nonlinear least-squares fitting of the data to a single exponential plus a constant. The dashed lines indicate the exchange rates calculated for the same amide in a random coil environment. Protection factors, defined by the ratio of the two rate constants, are 24 for Leu-159 and 2 for Ile-175.

