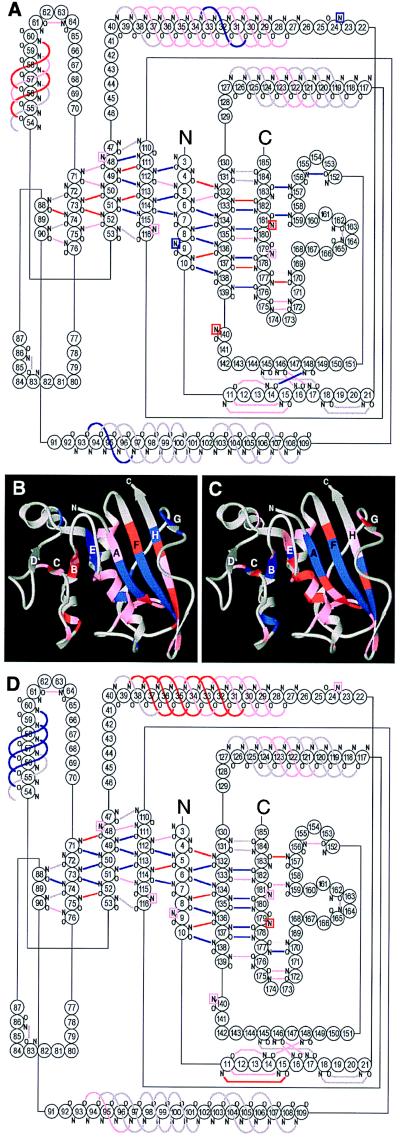
Figure 4.
Location of protected amides in GroEL-bound and native DHFR. (A) Diagram of hydrogen bonds in DHFR, colored according to the degree of protection in the GroEL-bound state. Blue represents protection factors >10, red between 5 and 10, pink <5 or unmeasurable, and gray hydrogen bonds that are inferred from the crystal structures but not observed by NMR. Probes that do not form hydrogen bonds directly with backbone or side chain acceptors are shown in boxes whose color reflects the degree of protection. Hydrogen bonds were identified from the x-ray structures of DHFR (27, 28) using the program hbplus (29). (B) Ribbon diagram of native DHFR (28), displaying the protection factors of the GroEL-bound state, colored as in A. (C and D) Ribbon (C) and hydrogen bond diagrams (D) displaying the protection factors measured for native DHFR. Blue represents protection factors >9 × 10⁶, red between 2.5 × 10⁶ and 9 × 10⁶, and pink <2.5 × 10⁶.

