
Figure 4.
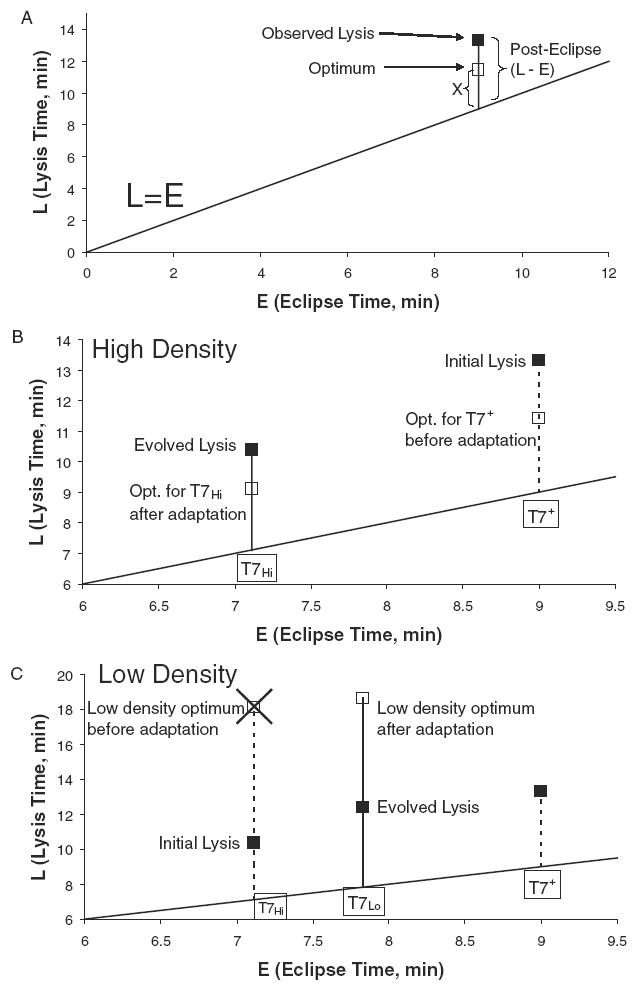
Adaptation of lysis times. Lysis time (L) can be broken down into eclipse time (E) plus posteclipse time (L – E). Optimal lysis time is predicted as approximately E + X, where X = 1/r plus a small correction for variance in lysis time from Appendix 1. For this reason, a line L = E provides a useful baseline for comparison of these values. In all cases, the putative optimum is based on current fitness (r) and eclipse time, hence it is subject to change as these traits adapt. (A) Not surprisingly, T7+ lysis was not optimal in high host density conditions, prior to its adaptation. (B) After adaptation to high host density, the lysis time approached the optimum; eclipse time also shortened. (C) After adaptation to low host density, evolved lysis time increased slightly but remained well short of the putative optimum. Surprisingly, eclipse time also increased in this selection. The optima in these figures are referred to as putative optima, because their values are based on the observed r rather than the r that would be achieved at the optimum  . The low-density conditions used in these adaptations used a mix of permissive and nonpermissive hosts (the formal low-density adaptation).