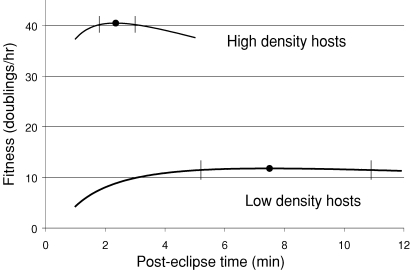
Figure 5.
Strength of selection for the optimum. Equation (A4) was used to plot fitness against average lysis time (posteclipse time) for parameters somewhat matching those of the high- and low-density adaptations. The optimum is at the peak, indicated by the filled circles. The vertical bars through the curves indicate a type of selective equivalence for 60 h of adaptation: if a homogenous population's initial lysis time was at the boundary of this interval, a mutant whose lysis time was exactly optimal would ascend from an initial frequency of 10−6 to 0.5 in 60 h. Populations whose starting genotypes were inside this interval thus may not be able to evolve the optimal lysis time (in 60 h of adaptation) even if the appropriate mutations arose. However, the strength of selection for the optimum is substantially greater at high host density than at low. Parameters were (R = 80, c = 0.4, E = 7.1, σ2 = 0.5 for high density; R = 70, c = 0.004, E = 7.8, σ2 = 0.9 for low density, with an additional term added to account for nonpermissive hosts from Bull 2006). No attempt was made to fit the observations quantitatively.

