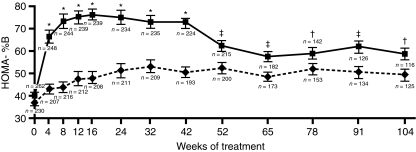
Figure 2.
Improvement in β-cell function over 2 years of treatment with either pioglitazone or gliclazide [Tan et al. 2005 (19)]. The gliclazide group is shown by the solid line and squares. The pioglitazone group is shown by the dashed line and diamonds; *p < 0.0001, ‡p < 0.01, †p < 0.05. Copyright © 2005 American Diabetes Association. From Diabetes Care, vol. 28, 2005, 544–550. Reprinted with permission from the American Diabetes Association

