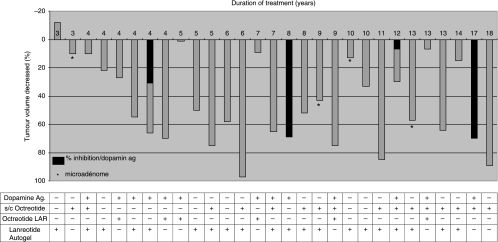
Fig. 3.
Individual evolution of the tumour volume in acromegalics treated with SSTa. The lined zone represents the ‘gain’ in reduction of volume in patients treated with dopamine agonist. Note that in two patients, the zone is lined in its entirety because the dopamine agonist was introduced at the same time as the SSTa treatment. The asterisk corresponds to microadenomas. The table summarizes the SSTa treatment followed by each patient.

