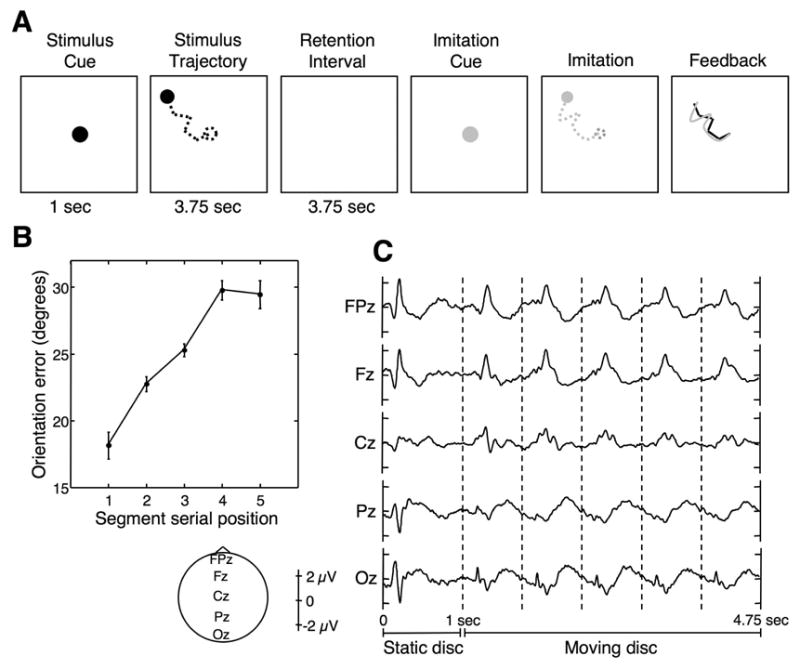
Figure 1.

Stimuli and results. A: Example of a memory trial. Note that while viewing and reproducing the stimulus, the disc did not leave a trace, so subjects only saw its instantaneous position; the dashed lines are for illustration purposes. B: Behavioral results. Segment orientation error is plotted against segment serial position. Error bars are within-subject SEM (Loftus & Masson, 1994). C: ERPs at the midline electrode locations for the memory condition, time-locked to the onset of the disc’s appearance on the display. Vertical dashed lines indicate the onset of individual motion segments. The 4.75 seconds for which ERPs are displayed correspond to the period during which subjects viewed the stimulus models.
