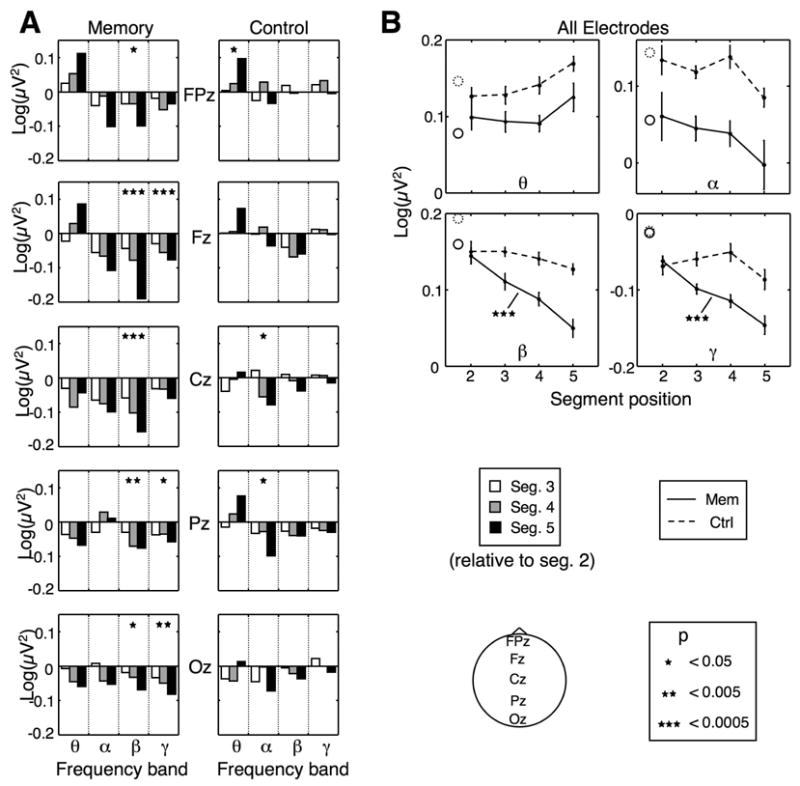
Figure 3.

Modulation of high-frequency oscillations. A: Energy in four standard frequency bands in the memory and control conditions at midline electrode locations. Each group of bars corresponds to a different frequency band, and shows the energy for segments 3, 4 and 5 (left, middle and right bars, respectively) relative to the energy for segment 2. B: Mean energy across all electrodes in each band as a function of serial position, in the memory (solid line) and control (dashed line) conditions. The solid and dashed circles indicate the energy in the first segment. All significance markers are similar to Fig. 2. Error bars are within-subject SEM for each condition.
