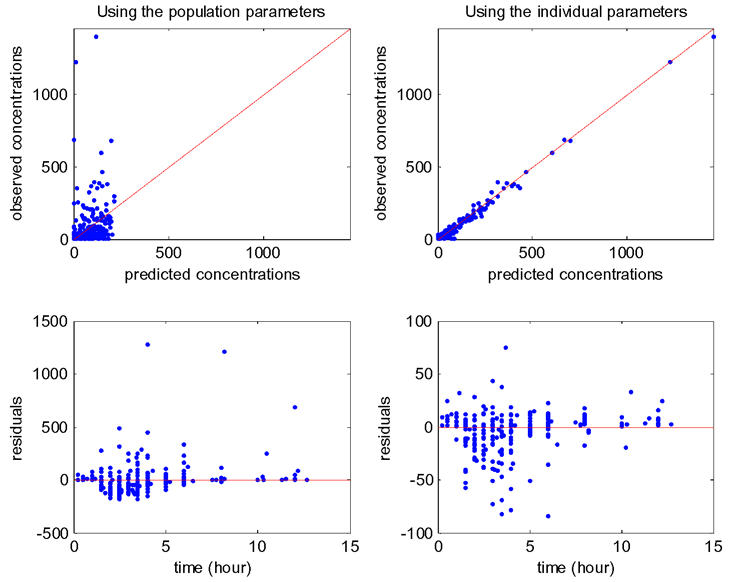
Figure 6.

Goodness of fit plots for model 4 (BMI on CL/F). Top: observations versus predictions (in ng/ml), with on left population prediction and on right individual predictions; bottom: residuals versus time, with on left population residuals and on right individual residuals
