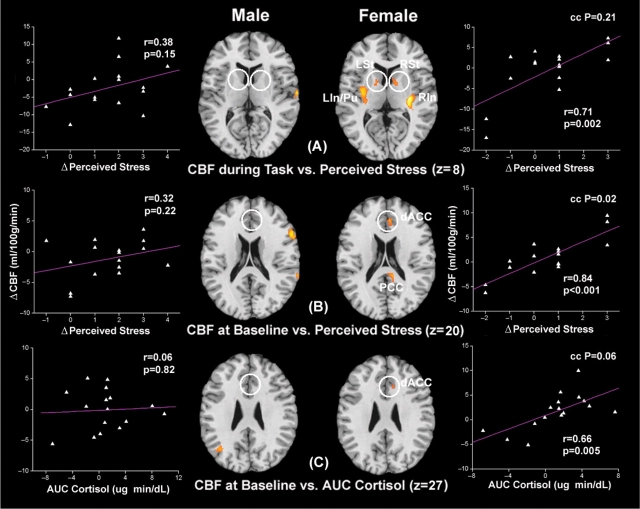
Fig. 4.
Axial sections of regression analysis results performed in the male and female group, respectively, showing limbic and cingulate activation only in females. The analyses are the same as shown in Figure 2. Scatter plots of corresponding CBF changes in ventral striatum and dACC ROIs (indicated by white circles) as a function of perceived stress or AUC measures of salivary cortisol are displayed.

