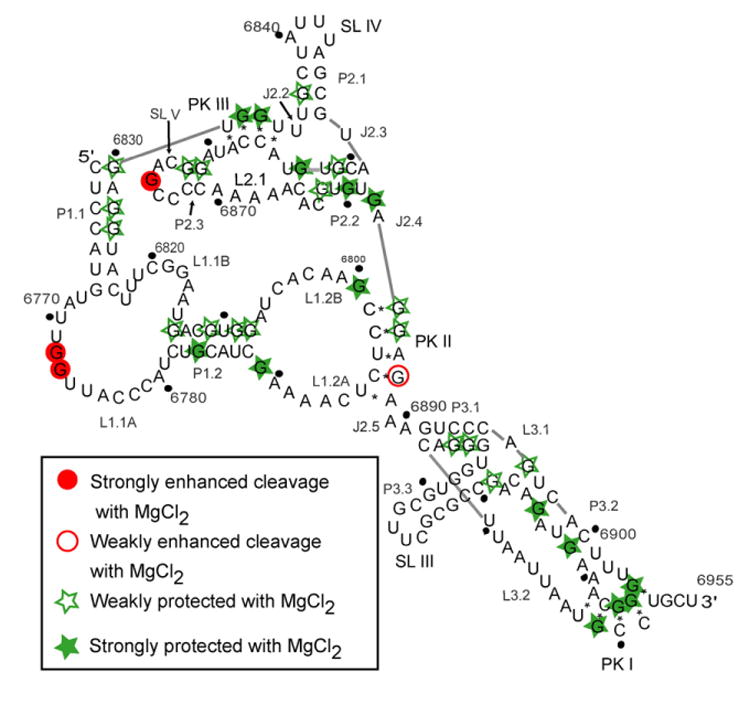
Figure 5.

RNase T1 probing on the TSV IRES showing the cleavage pattern that resulted when the IRES was allowed to fold in the presence of MgCl2. Filled circles indicate that the G base was strongly protected from the RNase upon the addition of the cation. Open circles represent G bases that were weakly protected. Open stars are indicative of G bases that were weakly cleaved more in the presence of the cation. Filled stars depict G bases that were strongly cleaved in the presence of the Mg2+ cation.
