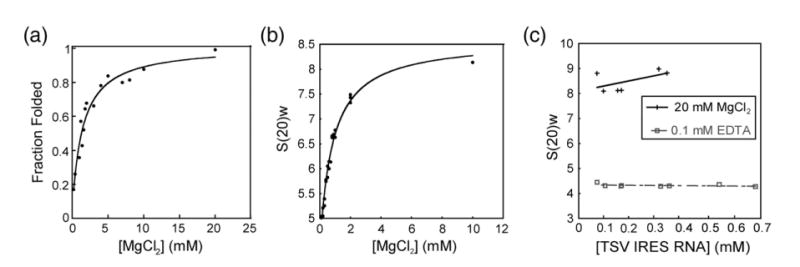
Figure 6.

Folding of the TSV IRES as a function of MgCl2. (a) Graph of hydroxyl radical probing of full length TSV IRES RNA with varying concentrations of MgCl2. The plot shows fraction folded versus [MgCl2], fitted by a Langmuir isotherm. (b) Graph of sedimentation coefficient of the full-length TSV IRES RNA as a function of the concentration of MgCl2. (c) Graph of sedimentation coefficient of the full-length TSV IRES RNA at several [RNA], both in the absence and presence of MgCl2. These plots indicate no significant deviations from ideality that would affect our interpretation. The continuous line represents the 20 mM MgCl2 and the broken line represents 0.1 mM EDTA.
