
Figure 7.
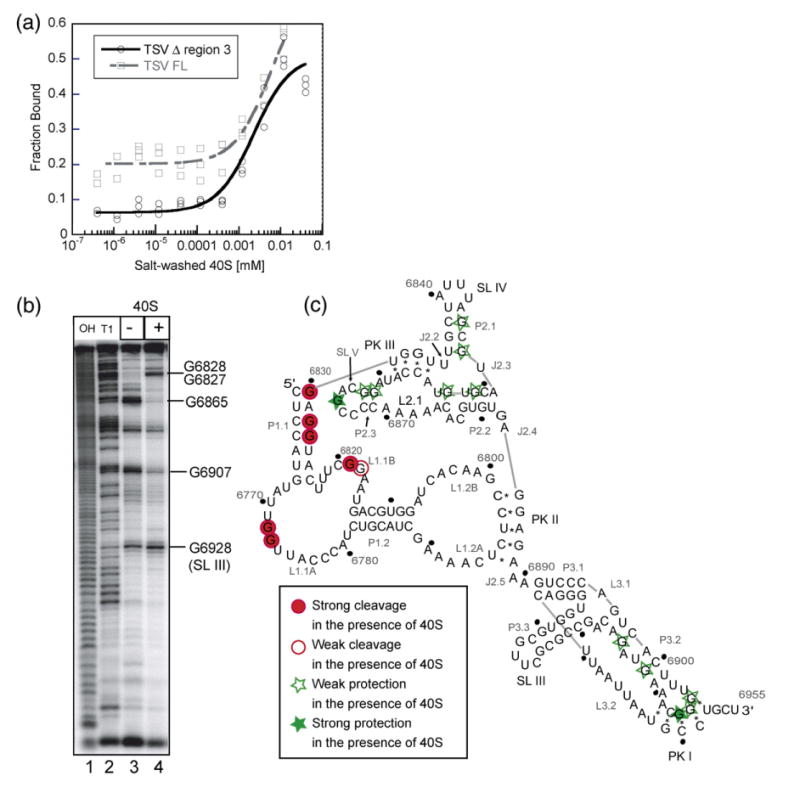
Binding of the small ribosomal subunit to the TSV IRES. (a) Fraction of TSV IRES bound plotted as a function of the small ribosomal subunit concentration. The broken line represents the wild-type and the solid line represents the mutant IRES. (b) A representative RNase T1 footprinting gel, in the absence (lane 3) and presence (lane 4) of 40 S ribosomal subunit. Lanes 1 and 2 are the hydrolysis ladder and RNase T1 ladder, respectively. Selected G residues are labeled to the right of the gel. (c) Footprinting results mapped on the secondary structure. Dark grey circles indicate that a G base was strongly cleaved when the small ribosome subunit was present. Light grey circles indicate that a G base was weakly cleaved when the small ribosome subunit was present. Light grey stars represent the weak protection offered by the 40 S subunit, while the dark grey stars represent G bases that were strongly protected.