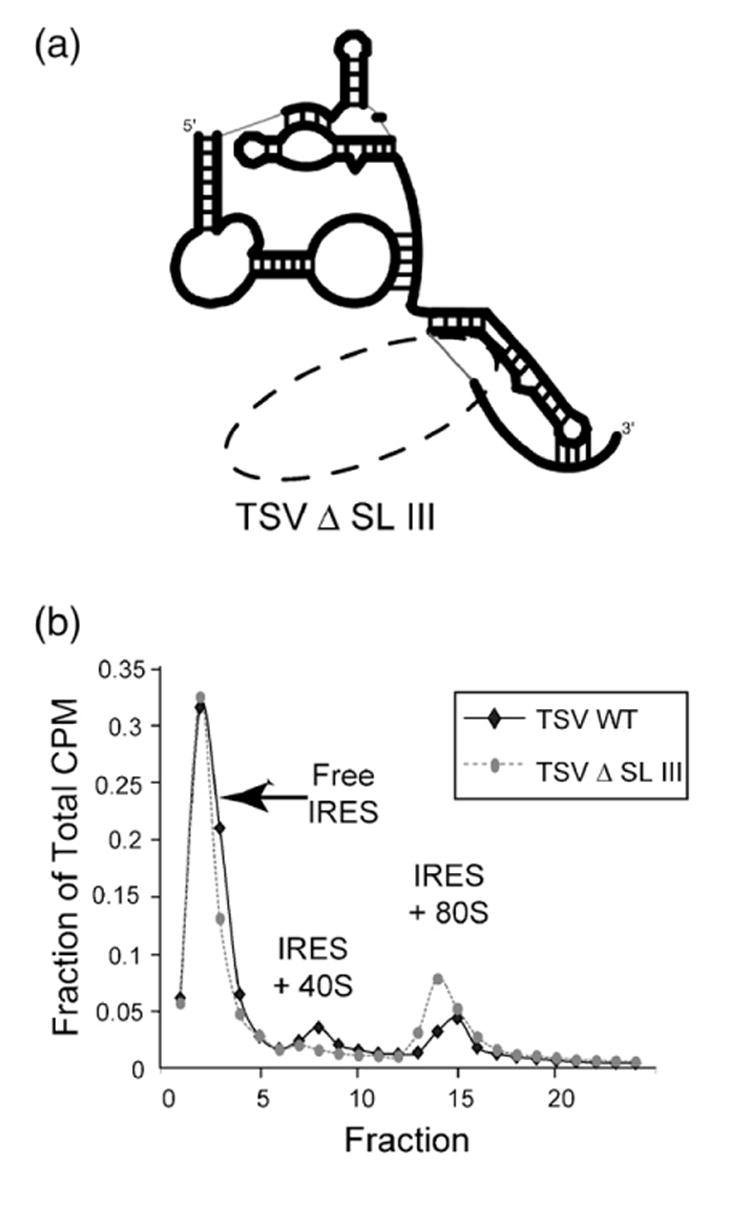
Figure 8.

Ribosome assembly assay of TSV and a mutant lacking SL 3. (a) Schematic cartoon representation of the TSV IRES RNA mutant used in the assay; the broken oval shows where SL III has been removed. (b) Traces from the ribosome assembly assay with full-length TSV IRES RNA and the SL III deletion mutant. The profiles are plotted based on the percentage of the total counts per minute (CPM) in each fraction. Full-length is represented by a bold black line, while the mutant is represented by a broken line.
