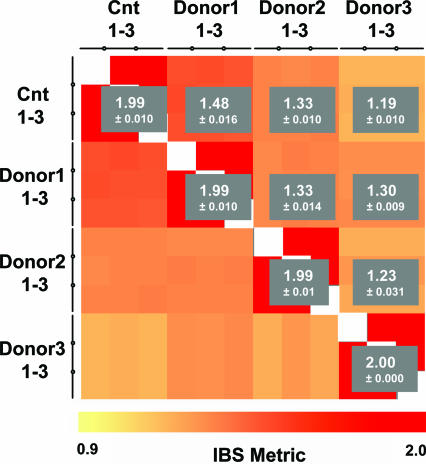
Figure 2.
Sample mismatch analysis showing IBS scores of chip to chip comparisons of 250K SNP array. Heat map showing the result of a sample mismatch analysis comparing all SNP arrays against each other. The color of each square indicates the IBS score between SNP samples ranging from 0.9 to 2. The gray boxes indicate the average IBS score and SD between each group. Cnt, control DNA.

